Activity Mapping - Example: Mapping of Activities on Domestic Violence in Cambodia
 |
Step 1: Definiton of the Research QuestionThe GTZ project “Promotion of Women’s Rights” assists the Cambodian Step 2: Identification of existing information and core issuesInformation and reports on ongoing activities of related organizations were collected, the project identified the following core field activities to combat “Domestic Violence”:
Step 3: Define a grid of activities that are commonly applied to tackle the identified core issuesBased on the previous core field of activities, each field was specified in detailed categories - a number of activities and services has been identified A. Information and Education Campaigns:
B. Training:
C. Policy and Advocacy:
D. Services:
Step 4: Identify the level on which information about the activities is collectedDifferent organizations implement their activities on Provincial, District, Commune and Village level. For the mapping activity a decision needed to be made on which level information is going to be collected. This decision includes a trade off between too detailed information on the village level or the danger of collecting not enough information on the province level. Since the major actors working domestic violence are bigger organizations with a wide coverage, the project decided to carry out activity mapping on district level. Step 5: Identify the target organisations to be invited for an activity mapping exercise / workshopMore than 90 organizations were invited to participate at the mapping exercise. To some organizations, that were not able to attend the workshop, the questionnaires were submitted, and assistance was given to fill them correctly.
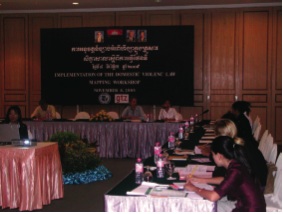
Photo 1: Participants get briefed about the Methodology
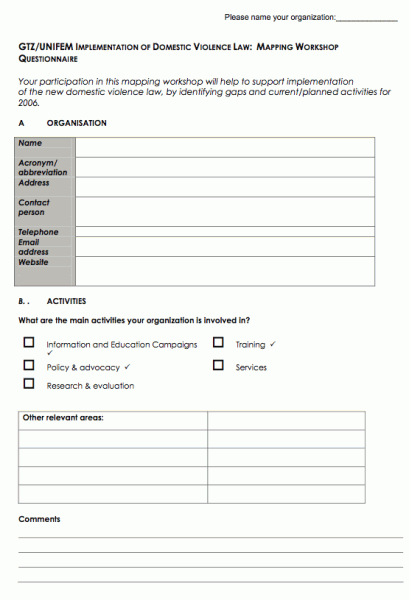
Step 6: Develop and pretest a questionnaireAn introductory questionnaire was designed with the aim to collect contact information and details about the particular organization implementing activities in related fields. |
 |
Figure 1: Activity Mapping Questionnaire (Excerpt)
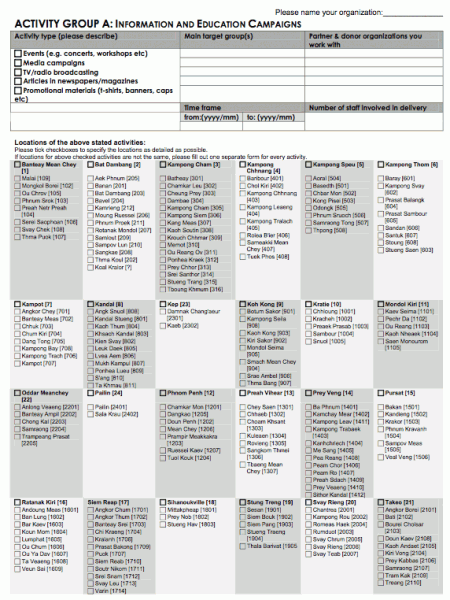
to be continued for every core issue...
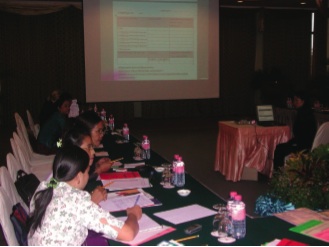
Photo 2: Introduction of the questionnaire to the participants
The questionnaires also asked the location of the ongoing activities, information on the time frame and target groups. The questionnaire consisted of different forms. For each activity the organization were requested to fill one form so the researchers could refer one activity to one location. If an organization conducted several activities in the same coverage area, they were requested to fill in several forms with the additional information of time frame and target groups for the specific activities.
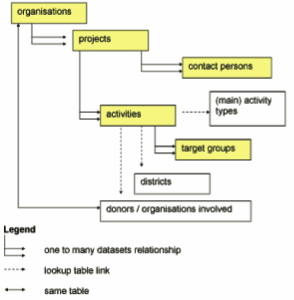
Step 7: Activity Mapping Workshop: Data collectionA web database and a web mapping system has been set up to store, retrieve and visualize the collected data. After the workshop, project staff was assigned to fill the questionnaires into the database as well as contact information of organizations and contact persons. Figure 3 depicts the structure of the database. Figure 2: Data entity relationships
The web database was useful to collect, enter and cross-check the data gathered by multiple users in a short period of time. Some questionnaires have been sent out to some organizations based in the countryside, which were not able to attend the workshop.
Step 8: Data processing and -analysis
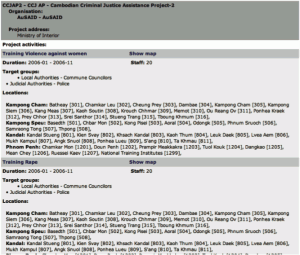
Figure 3: Activity Mapping Catalogue
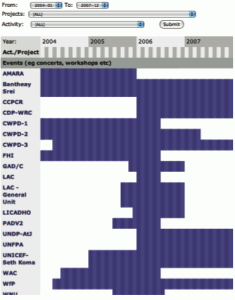
Since the time frame was included in the questionnaire, it was also possible to visualize the time span (Figure 2), some activities were ongoing. However, information on future and past activities were assumed to be not comprehensive. Figure 4: Time span of activities
|
|
|
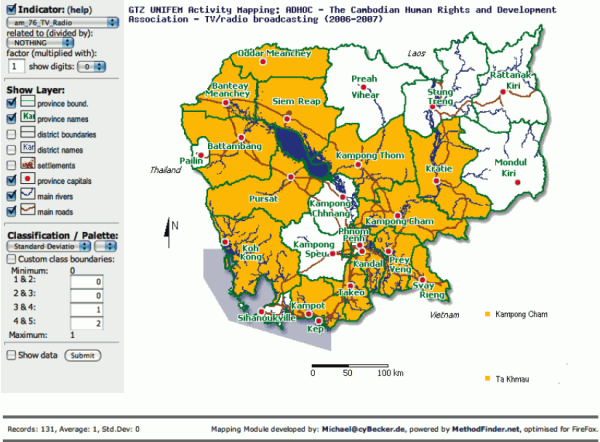
Step 9: Visualisation and redistribution of resultsMore than 180 maps have been generated from the database using a mapping module, which visualized the statistical data of the database. In general, for every organization and activity, one map has been produced as shown in Map 1. Map 1: Coverage of ADHOC: TV/radio broadcasting on domestic violence
|
 |
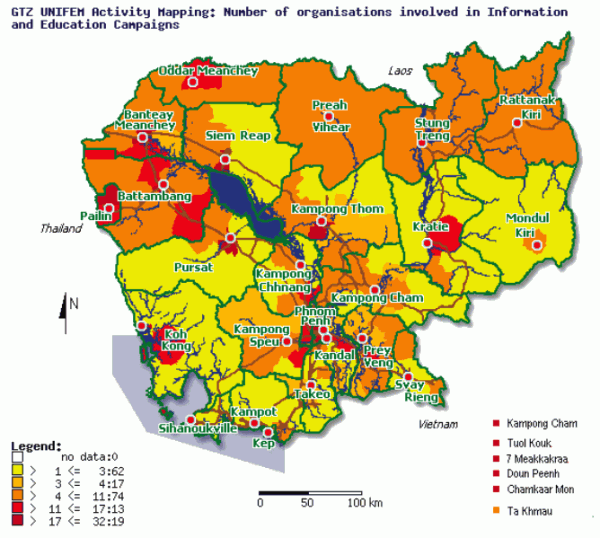
For each activity and core issue, the number of involved organizations have been counted and therefore the entire coverage of services was visualized (shown in Map 2) and discussed.
Map 2: Number of organisations involved in Informaion & Education Campaigns Step 10: Discussion of Results / Policy Making
|
