Functional Analysis - Principles and General Procedures
|
|
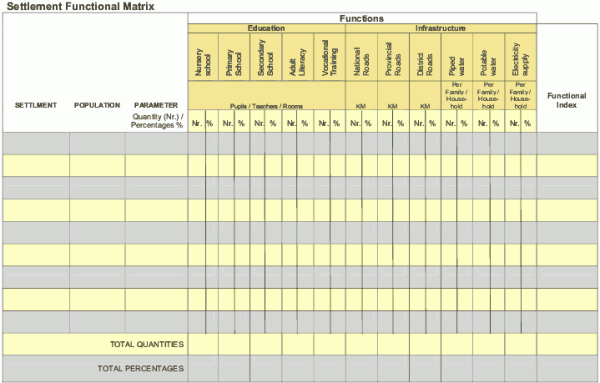
Basic Steps:The initial step in the settlement functional analysis is to prepare a map which shows the spatial distribution of all regional urban places and their population size. Thus the following steps are necessary: Step 1:List all urban places in descending order according to their population size. Start with the largest urban place and end with the smallest. Step 2:List all important functions and activities considered in the head of the matrix. These are to be arranged into sub-categories such as educational, health, economic activities and administrative functions. In order to measure quantities, identify indicators or proxy indicators. Step 3:Draw a series of vertical and horizontal lines which form the grid of the matrix and indicate for each grid the quantities of the respective functions or activities. Step 4:Count the number of quantities for each function column by column and indicate the findings under the total functions. Step 5:Calculate the percentage column by column to measure the scores given to each quantity unit. Step 6:Count the percentages row-by-row in order to obtain the total functional index which indicates the level of service. The classification of the settlement pattern into high, middle or low ordered centres is done according to the index. The assumption that all functions receive the same weight limits the functional analysis. The different importance of the functions are not reflected. In general it might be possible to introduce specific additional weighting factors for each sub-category. This is advisable in the event that specific analytical questions such as evaluation of urban centres There are various methods for grading or ranking centres, and the simplest is by plotting the score obtained by each settlement in a histogram starting with the highest score and ending with the lowest, and then analysing the peaks and troughs. It is important to notice that with regard to regional or district data organisation the functional matrix can be used as an inventory for economic, social, technical infrastructure and agricultural analysis as well as other parameters that may be deemed important. Table 1: Example of functional matrix
|
 |
It is a simple and useful tool as most of the required data is available at the district, provincial or regional levels. The information can also be used by potential investors for site location or investment decisionmaking. Coordination of different service providers and line ministries is another potential use of the functional matrix. |

